How much is one tonne of CO2 anyway?
When talking about climate change, the Unit of CO2 equivalent in tonnes appears everywhere. At least for me, it was difficult to have an intuition of what this unit means. Is a tonne much or not? Is saving a Kg of CO2 worth it?
Let me take you through some examples which should help you understand the implications of of such values. First I want to give you some common CO2 values for the annual emissions of a human being, driving a car and flying. In the second part I will then show you two examples from IT, the CO2 emissions of a server, a mobile phone and the CO2 emissions of a news website.
The annual emission of a human
To give you an idea about the emissions of CO2 equivalent, I would like to give you the numbers for my country, Switzerland:
In 2022, the greenhouse gases released into the atmosphere within Switzerland amounted to 41.6 million tonnes of CO2 equivalents (not including international air traffic and shipping). This gives a per capita greenhouse gas release of 5 tonnes of CO2 equivalents (CO2: 4 tonnes per capita).
However, if the emissions generated abroad by the production of imported goods are also taken into consideration, total annual per-capita emissions are more than doubled (approx. 13 tonnes of CO2 equivalents per capita in 2021). As a result, Switzerland’s greenhouse gas footprint is well above the global average of about 6 tonnes of CO2 equivalents per capita.
(source)
Driving a car
Driving is a daily activity for many of us, and with it comes direct CO2 emissions. To illustrate the impact of an individual car, let’s take a closer look at a typical European vehicle: the Volkswagen Golf 2.0 TDI.
The emissions data used here are sourced from a Volkswagen publication. While it’s important to acknowledge the Volkswagen emissions scandal, other sources, such as Wikipedia, report comparable values for this model. Thus, while the precise numbers may vary slightly depending on testing conditions and methodologies, the general range is representative of this type of car. It’s worth noting that larger vehicles or those with bigger engines generally emit significantly more CO2.
According to the sources mentioned, the Volkswagen Golf 2.0 TDI produces approximately 140 g of CO2 per kilometer under typical driving conditions. To break this down:
- For every 100 kilometers driven, the car emits 14 kilograms of CO2.
- To reach a total of 1 tonne of CO2 emissions, you would need to drive 7,200 kilometers.
To contextualize these numbers, consider that the average European driver covers approximately 10,000 to 20,000 kilometers annually. This means a single car would emit around 1.4 to 2.8 tonnes of CO2 per year.
Flying
Flying is widely recognized as one of the most environmentally damaging modes of transportation. But what does this mean for individual passengers? Let’s break it down.
To understand the emissions from air travel, I used the online tool provided by myclimate.ch. This tool calculates the CO2 emissions for individual flights, taking into account factors such as distance, aircraft type, and class of travel.
- Long-Haul Flight: Zürich to New York (Round-Trip, Economy Class)
Total emissions: 2.2 tonnes of CO2.
This is a significant contribution to a person’s annual carbon footprint, equivalent to driving a car nearly 16,000 kilometers based on an average emission rate of 140 g CO2 per kilometer. - Short-Haul Flight: Bern to Zürich (One-Way, Economy Class)
Total emissions: 120 kilograms of CO2 for a flight of just 100 kilometers.
To put this into perspective, this short-haul flight emits nearly the same CO2 as driving a car for 900 kilometers.
A server
Now, let’s take a look at the emissions associated with a typical server. As an example, I’ve chosen the Dell PowerEdge R640 (2019), with calculations based on a 4-year lifecycle (source).
The CO2 emissions of a server come primarily from two sources:
- Manufacturing (16.6%)
This includes raw material extraction, production processes, and assembly. For the Dell PowerEdge R640, this accounts for a substantial but smaller proportion of total emissions. - Usage (83%)
The dominant factor in a server’s lifecycle emissions. This includes the electricity consumed during operation, which depends heavily on energy efficiency and the carbon intensity of the electricity grid where the server operates.
Other factors, such as transportation and end-of-life retirement, contribute minimally and are generally considered negligible in comparison.
Over its 4-year lifecycle, the total CO2 emissions of this server are approximately:
- 1.9 tonnes per year
- 7.7 tonnes for its entire lifecycle
These numbers represent a typical configuration of the server. However, the actual emissions can vary significantly depending on the server’s purpose and workload. Standard configurations for general-purpose computing will align with these numbers. High-performance servers, such as those designed for AI model training or data-intensive applications, can consume significantly more energy, resulting in much higher emissions.
A mobile phone
Smartphones have become an integral part of our lives, but they also contribute to CO2 emissions throughout their lifecycle. To understand their environmental impact, let’s look at two popular high-end models: the iPhone 15 and the Samsung Galaxy S23.
According to their respective environmental reports, the CO2 emissions over the 3-year lifecycle of these devices are:
- iPhone 15: 66 kg CO2
- Samsung Galaxy S23: 58 kg CO2
These numbers account for the entire lifecycle of the devices during three years. Unlike servers, where usage dominates the carbon footprint, smartphones are primarily impacted by production.
Here’s an example of the distribution for the Samsung Galaxy S23:
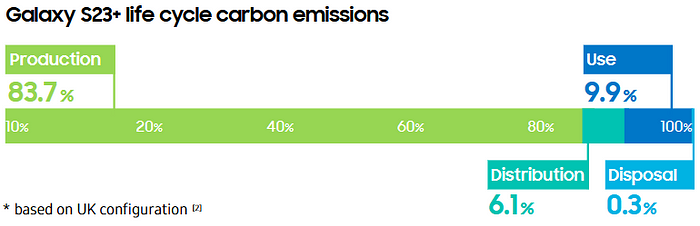
As shown, production is the dominant factor, emphasizing the need for sustainable manufacturing practices and longer device lifespans. This highlights the importance of extending the lifespan of smartphones. By using a phone for 5 years instead of 3, the per-year CO2 impact is significantly reduced.
While the emissions of a single smartphone may seem small, they add up when considering the billions of devices in use worldwide. For perspective, 1 tonne of CO2 emissions is equivalent to approximately 17 smartphones. Global smartphone production accounts for a significant portion of the tech industry’s carbon footprint, contributing to e-waste and resource depletion as well.
A website
As a final example, let’s examine the emissions of a popular Swiss news website, 20min.ch, using the EcoGrader tool to analyze its environmental impact.
According to EcoGrader (measured on December 4, 2024):
- Homepage Emissions: 3.24 g CO2 per load
- Subpage (article) Emissions: 1.46 g CO2 per load
These emissions might seem negligible for a single page load, but they add up quickly when considering the website’s vast audience. In 2021, 20min.ch reported over 1.2 million users per day. Based on this number, the homepage alone generates approximately 3.9 tonnes of CO2 per day.
By focusing on sustainable design and hosting practices, even small changes can lead to massive reductions in emissions, particularly for high-traffic websites like 20min.ch. This example underscores the responsibility and opportunity that we as IT professionals have to lead the way in reducing digital carbon footprints.
Conclusion
The numbers I showed you in this article aim to provide a clearer sense of what 1 tonne of CO2 truly represents and how our everyday activities, from driving to using digital technology, contribute to global emissions. While CO2 emissions from IT might seem abstract, they have tangible impacts — and the good news is, as IT professionals, we have the tools and influence to make a significant difference.
If you work in IT, here are three key takeaways to help reduce your CO2 footprint:
- Maximize Server Utilization:
Ensure servers are operating at high efficiency by consolidating workloads and using virtualization or cloud services effectively. Underutilized servers waste energy and resources. - Extend the Lifespan of End-User Devices:
Design software that runs efficiently on older devices to reduce the need for frequent hardware upgrades. The longer a device is used, the lower its annualized carbon footprint. - Optimize Websites for Efficiency:
Use tools like EcoGrader or Globemallow to identify areas for improvement. Smaller, faster-loading websites reduce energy consumption for both servers and end users.
Small changes, when implemented at scale, can have a profound impact. For example, optimizing a high-traffic website could save tonnes of CO2 each year, while designing hardware-agnostic software encourages sustainable device usage across millions of users.
